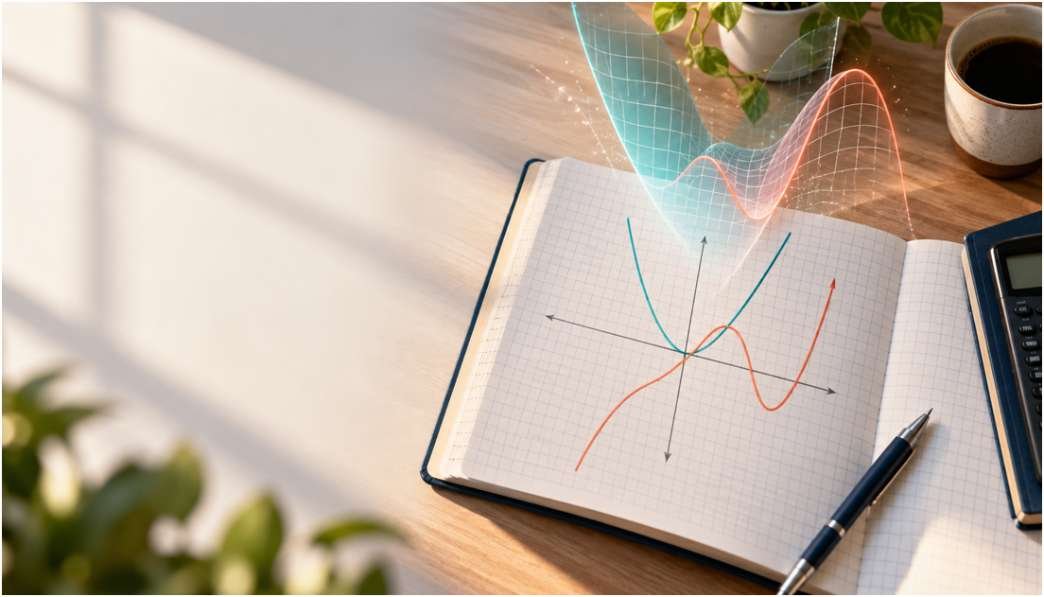
A graph can look like a puzzle when you only know how to plot points. The change that helped me was asking three questions: What inputs work? Where does the graph go? Why does it bend or turn?
That is the practical answer to how to master functions and graphs in math. Learn to move between the equation and the picture, then use calculus to explain what the picture does. You do not need to memorize every possible curve.
Start With What a Function Actually Does
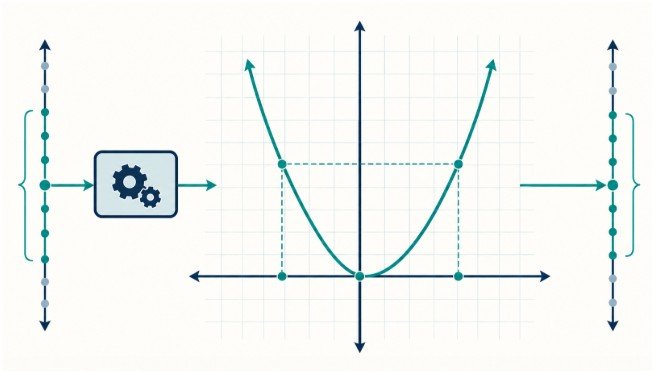
A function assigns exactly one output to each allowed input. If f(x)=x2−4f(x)=x^2-4, then f(3)=5f(3)=5. The notation f(3)f(3) means “the output when the input is 3.”
The allowed inputs form the domain. The outputs form the range. For f(x)=xf(x)=\sqrt{x}, real-number inputs must satisfy x≥0x\geq0. For f(x)=1/(x−2)f(x)=1/(x-2), the input cannot equal 2 because division by zero is undefined.
A graph passes the vertical line test when every vertical line meets it at most once. That test checks whether each xx-value has only one yy-value. It does not tell you whether the graph is continuous or smooth.
Before sketching, I find it useful to write the domain beside the equation. This small step prevents a common mistake: drawing a curve through an xx-value where the function does not exist. Khan Academy’s domain lesson offers extra practice.
Recognize Parent Graphs, Then Change Them
Learn the basic shapes of xx, x2x^2, x3x^3, ∣x∣|x|, x\sqrt{x}, 1/x1/x, and 2×2^x. You should be able to sketch each one roughly without a calculator. Focus on its intercepts, domain, range, and overall direction.
Read transformations from the equation
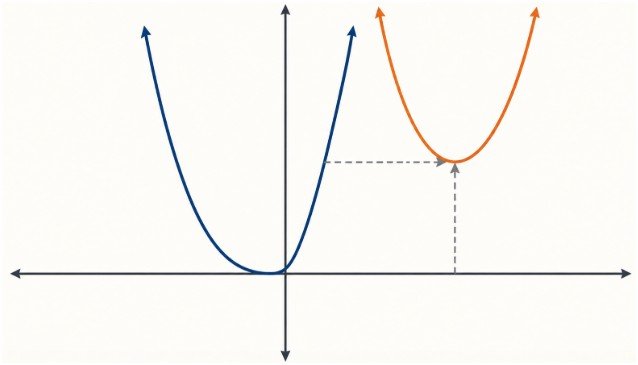
If you know y=x2y=x^2, you can sketch y=(x−3)2+2y=(x-3)^2+2 by moving the parabola right three units and up two. Its lowest point moves from (0,0)(0,0) to (3,2)(3,2).
The sign inside the brackets often feels backward: f(x−3)f(x-3) shifts a graph right, while f(x+3)f(x+3) shifts it left. A negative sign outside, −f(x)-f(x), reflects the graph across the xx-axis. A negative sign inside, f(−x)f(-x), reflects it across the yy-axis.
Multiplying the output by 2 doubles every yy-value. These rules let you predict a graph’s shape before calculating many points. Check two or three coordinates afterward; they will catch a mistaken shift.
Sketch a Graph With Evidence, Not Guesswork
For each new equation, I use the same order: domain, intercepts, key features, then a few checking points. This works better than plotting ten random coordinates and hoping the shape becomes clear.
The yy-intercept comes from setting x=0x=0, provided zero is in the domain. The xx-intercepts come from solving f(x)=0f(x)=0. A quadratic may have two, one, or no real xx-intercepts.
Watch for breaks and end behavior. A rational function can have an excluded input without having a vertical asymptote there: cancellation may leave a hole instead. An asymptote describes how a graph behaves near a value or far from the origin. A graph may cross some asymptotes, so “never touches” is not a reliable rule.
A three-view workout with one function
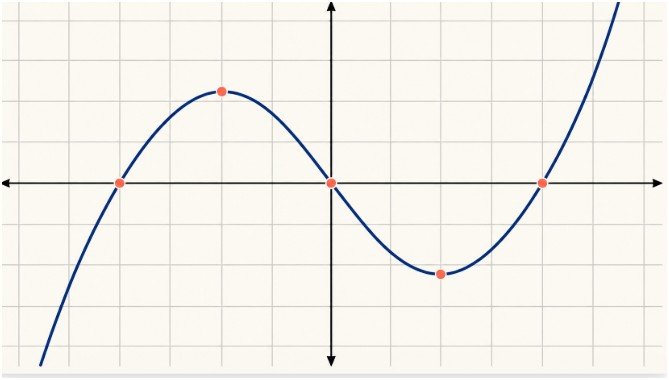
Try f(x)=x3−3xf(x)=x^3-3x. First, read the equation. It is a cubic with domain all real numbers. Factoring gives f(x)=x(x2−3)f(x)=x(x^2-3), so its xx-intercepts are −3-\sqrt3, 00, and 3\sqrt3.
Next, predict the graph. The x3x^3 term tells you the left end falls and the right end rises. Also, f(−x)=−f(x)f(-x)=-f(x), so the graph has symmetry about the origin.
Finally, explain its turns with calculus. Its derivative is f′(x)=3×2−3f'(x)=3x^2-3. Setting this to zero gives x=−1x=-1 and x=1x=1. The derivative is positive outside those values and negative between them. The graph therefore rises, falls, and rises again. Substitution gives a local high point at (−1,2)(-1,2) and a local low point at (1,−2)(1,-2).
This one exercise connects algebra, symmetry, intercepts, and slope. When you can explain all four without looking at a plotted answer, you understand far more than the curve’s outline.
Connect Graphs to Calculus
A secant line measures the average rate of change between two points. A tangent line gives the slope at one point when that slope exists. The derivative, f′(x)f'(x), records those tangent slopes across the domain. MIT OpenCourseWare’s introduction to derivatives develops this connection.
Turn the graph into a derivative sketch
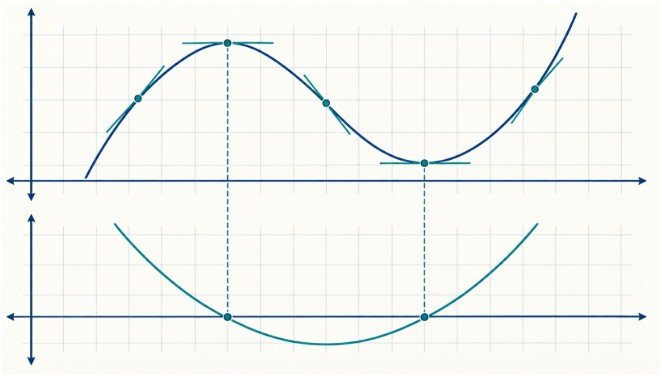
Read the original graph from left to right. Where it rises, f′(x)>0f'(x)>0. Where it falls, f′(x)<0f'(x)<0. At a smooth local peak or valley, f′(x)=0f'(x)=0. A horizontal tangent alone does not guarantee a turn: f(x)=x3f(x)=x^3 is flat at zero but keeps rising.
For the worked example, f′(x)=3×2−3f'(x)=3x^2-3 is an upward-opening parabola. Its zeros, −1-1 and 11, line up with the cubic’s turning points. This is a useful check when studying calculus derivatives.
Use concavity to explain the bend
The second derivative tells you how the slope changes. For our example, f′′(x)=6xf”(x)=6x. It is negative to the left of zero and positive to the right. The cubic changes from concave down to concave up at (0,0)(0,0), an inflection point.
Setting f′′(x)=0f”(x)=0 only finds a possible inflection point. You must check that concavity actually changes. Similarly, a derivative may fail to exist at a corner, a cusp, a vertical tangent, or a discontinuity. OpenStax’s curve-sketching lesson explains how first and second derivatives guide these checks.
An integral adds another view. A definite integral represents signed accumulation: regions below the xx-axis contribute negative values. It equals total geometric area only after you account for those regions separately.
Practice in Both Directions
If you are working out how to master functions and graphs in math, give each practice session two halves. In the first, start with equations and sketch graphs. In the second, start with graphs and describe a possible equation, domain, intercepts, and intervals where the function rises or falls.
For calculus practice, add a derivative sketch beneath each original graph. Then check your reasoning against a graphing tool or a worked solution. When you disagree, locate the exact error: an excluded input, a reversed shift, a missed sign change, or a point plotted incorrectly.
Spend about 25 minutes on three carefully chosen problems rather than racing through a page of similar ones. Revisit the problem you missed the next day without looking at your correction. Once one-variable graphs feel secure, vector calculus practice can extend the same habit of linking formulas to geometric meaning.
Frequently Asked Questions
1. What should I learn before graphing functions?
Be comfortable with coordinates, solving equations, factoring, exponents, and basic function notation.
2. How do I get better at graphing without a calculator?
Memorize parent shapes, identify intercepts and transformations, then check a few points by hand.
3. What is the easiest way to sketch a derivative from a graph?
Mark where the original graph rises, falls, or has a horizontal tangent; translate those features into positive, negative, or zero derivative values.
4. Why does the second derivative matter for graphing?
It shows whether slopes increase or decrease, helping you identify concavity and possible inflection points.
Make the Graph Prove Its Point
I know a graph has started to make sense when I can justify its shape before seeing a finished plot. Pick one function today, find its domain and intercepts, sketch it, and explain every turn. Then reverse the task: cover the equation and describe what the graph tells you.
Leave a Reply